Pine whitepaper
What does a four-space micro-resort actually earn?
A worked pro forma for a four-space micro-resort, labelled as an illustration and nothing more, with every assumption printed on the page so you can rebuild it with your own numbers.
The honest answer: there is no single number
A four-space micro-resort earns whatever its inputs make it earn, so the honest answer to the question in the title is that there is no single number, and anyone who hands you one without showing their assumptions is guessing. The result is governed almost entirely by figures you control or can look up: your nightly rate, your occupancy, your platform and cleaning costs, and what you carry for insurance, utilities, software, and maintenance. This guide gives you a fully worked illustration with every one of those assumptions printed on the page, so the value is not the bottom line we happen to reach. It is the model you can rebuild with your own numbers.
Every figure below is illustrative only. Pine builds and delivers spaces and software; it does not operate rentals and does not promise revenue, occupancy, payback, or profit. Pine does not provide tax, legal, or investment advice; consult your own advisors.
We work in this world every day, delivering the spaces that operators assemble into small properties, and the most useful thing we can do is not to promise you a return. It is to show you, line by line, how a model like this is built, which assumptions move it the most, and which costs the optimistic version conveniently forgets. Below we list the inputs, anchor each one to a real external benchmark, run a single labelled illustration, stress it against seasonality, name everything it leaves out, and then hand the whole thing back to you to rebuild with numbers that are actually yours.
The inputs that decide the whole model
A short-term rental pro forma has a small number of levers, and almost all of the outcome lives in the first two. Get honest about these before you get attached to any total.
- Average nightly rate. What a space actually books for, blended across the year, after discounts, not the peak-weekend headline rate.
- Occupancy. The share of available nights that sell. This is the single most powerful and most over-estimated input in any rental model.
- Seasonality. How that occupancy is distributed across the year, which matters as much as the annual average because it drives your cash flow and your ability to service debt in the slow months.
- Booking-platform fees. What the channels take, which varies by platform and by fee model, so treat it as a range, not a fixed number.
- Cleaning. The real cost per turnover, net of any cleaning fee you pass to the guest.
- Insurance. Short-term-rental or commercial coverage, quoted for your property, not a homeowner's policy.
- Utilities and consumables. Power, propane, water and waste servicing, connectivity, and the supplies a hosted stay burns through.
- Innkeeper service. Pine's monthly service plan, at a public price of 99 dollars per space per month, which runs the physical property from your existing booking calendar.
- Maintenance reserve. Money set aside every year against wear, not an expense you hope you will not have.
Notice what is not on that list yet: the capital cost of the spaces, the land, financing, income tax, and the value of your own time. Those belong in a full business case, and we handle them deliberately in a later section rather than burying them. The list above is the operating model. It tells you what a property throws off in a year before the bank, the tax authority, and your own labor are accounted for.
Where to anchor each assumption
The two inputs that move the model most, rate and occupancy, are also the two you should never invent. Anchor them to real data for your specific market, then discount for the fact that a new, seasonal property rarely performs like an established one in year one.
For occupancy and nightly rate, short-term-rental analytics services publish market-level benchmarks you can look up by location. As a national reference point, AirDNA's economists reported U.S. short-term rental occupancy of about 55 percent for the first six months of 2025.[1] That is a national blend across mature and new listings, so we deliberately model below it. For the demand backdrop, the annual North American camping report tracks participation and traveler behavior in outdoor hospitality specifically, which is a closer read on this kind of property than lodging in general.[2] And for the scale of the category you are entering, the federal Outdoor Recreation Satellite Account measures the outdoor recreation economy at hundreds of billions of dollars of value added, with RVing and camping among its largest conventional activities.[3]
The occupancy, rate, and demand figures above come from third parties and describe markets, not your property or any Pine outcome. Pine has no operating rentals of its own to cite. Use these to sanity-check your own inputs, then replace them with data for your exact market and comparable properties.
The discipline here is simple and worth stating plainly. Pull the occupancy and rate for your market and your closest comparable listings, then ask what makes your property different in its first two seasons, almost always fewer reviews and less booking history, and model conservatively below the benchmark rather than at it. A model that assumes you open at the market average is a model that has already talked itself into the answer it wanted.
A worked illustration, and nothing more
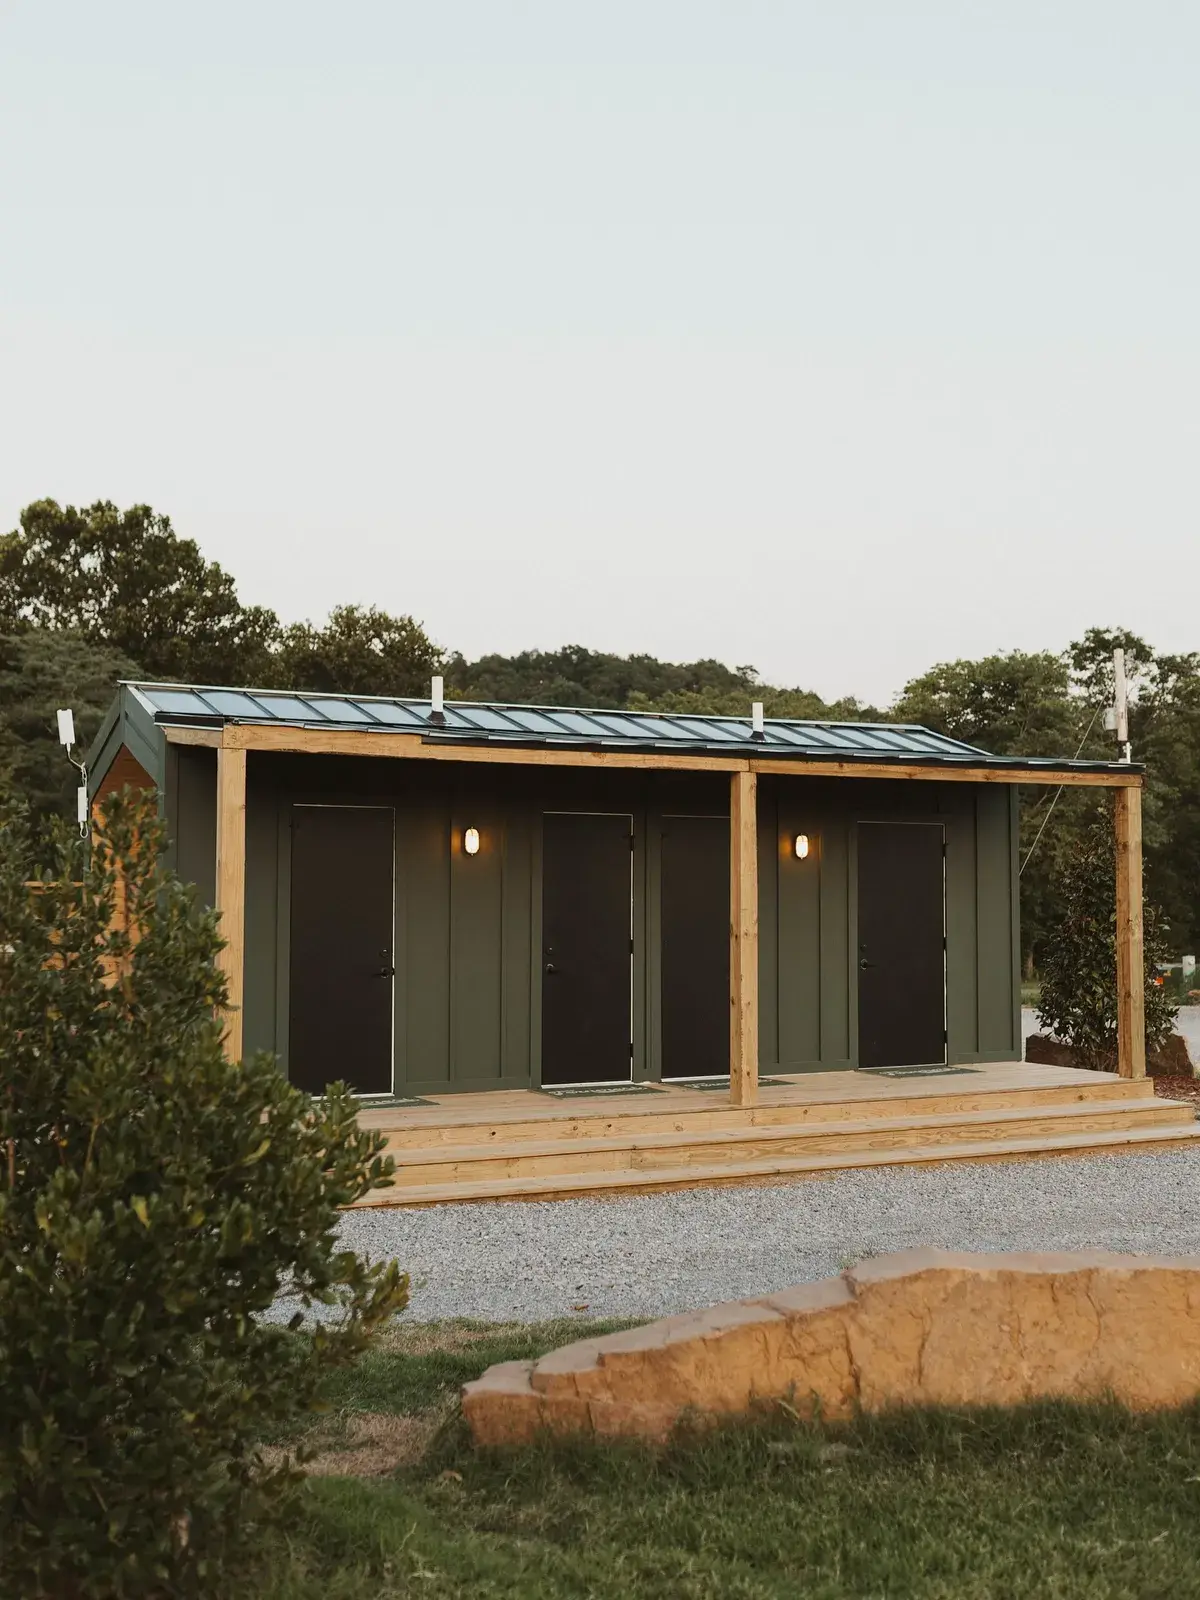
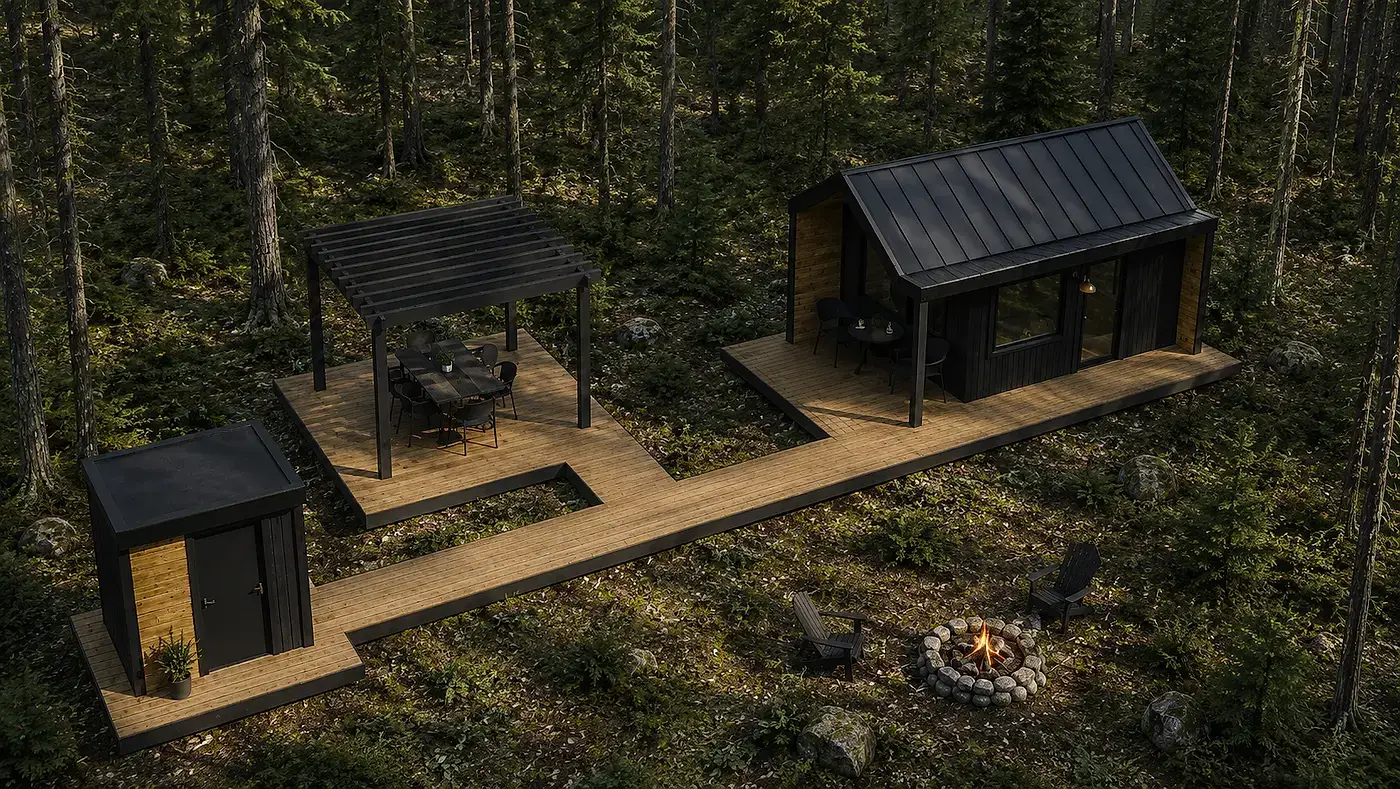
Here is one fully specified example. It is a single set of assumptions run to a single result, so read it as a demonstration of the method, not as a number to expect. We model four rentable spaces, the kind of small cluster you might assemble as a first property on your own land or as one node in a portfolio: think four Plus cabins, each with its own bath, set on connecting platforms. The arithmetic works the same for any four rentable spaces, whatever mix of cabins and shared baths you configure in Build & Price. The assumptions and the arithmetic are printed in full so nothing is hidden in a footnote.
| Line | Illustrative annual figure | Assumption behind it |
|---|---|---|
| Gross booking revenue | $131,400 | 4 spaces, 40% annual occupancy, $225 average nightly rate, 365 nights (4 × 146 nights × $225) |
| Booking-platform fees | ($13,140) | 10% of revenue, illustrative; platform fee models vary from roughly 3% to 15% |
| Cleaning, net | ($6,000) | Residual after a guest-paid cleaning fee offsets most turnover cost |
| Insurance | ($3,500) | Illustrative short-term-rental or commercial coverage; get a real quote |
| Utilities and consumables | ($5,000) | Power, propane, water and waste servicing, connectivity, supplies |
| Innkeeper service | ($4,800) | $99 per space per month × 4 spaces × 12 months (public Pine price) |
| Maintenance reserve | ($6,570) | 5% of revenue set aside against wear |
| Operating surplus | $92,390 | Before financing, income tax, land, management, and the owner's own labor |
Change one input and the whole picture moves, which is exactly the point. Drop occupancy from 40 to 30 percent and gross revenue falls by roughly a quarter, and because most of the cost lines are fixed rather than variable, the surplus falls by far more than a quarter. Raise the nightly rate by 20 dollars and, at this occupancy, revenue rises by a little under 12,000 dollars with almost no added cost. That sensitivity is why the honest deliverable of this guide is the model, not the 92,390. The bottom line is only as good as the two inputs on the first row, and those inputs are yours to research and defend.
Why the annual average hides your risk
A single annual occupancy figure is convenient and slightly dangerous, because it smooths over the part of the year that actually threatens a young property: the slow months, when the bookings thin out but the insurance, the software, and any loan payment do not. The camping demand data makes the same point in aggregate, that participation and nights concentrate heavily into the warm season.[2] Your model has to survive January, not just average it away.
| Season | Illustrative occupancy | What it means for cash flow |
|---|---|---|
| Peak, June to September | ~72% | Weekends book out, midweek fills; most of the year's surplus is earned here |
| Shoulder, April, May, October | ~42% | Weather-dependent and weekend-weighted; the swing months |
| Off, November to March | ~14% | Heated-space and holiday demand only; costs continue regardless |
| Weighted annual blend | ~40% | The single figure used in the model above |
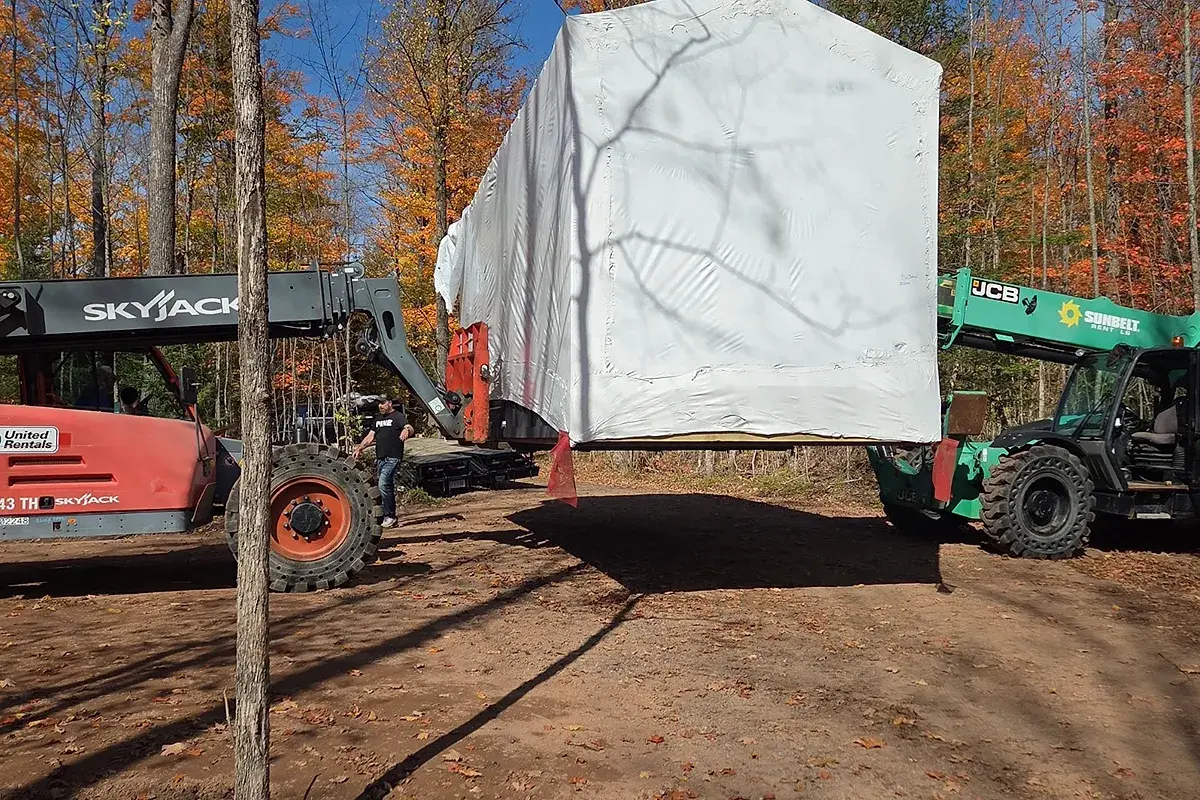
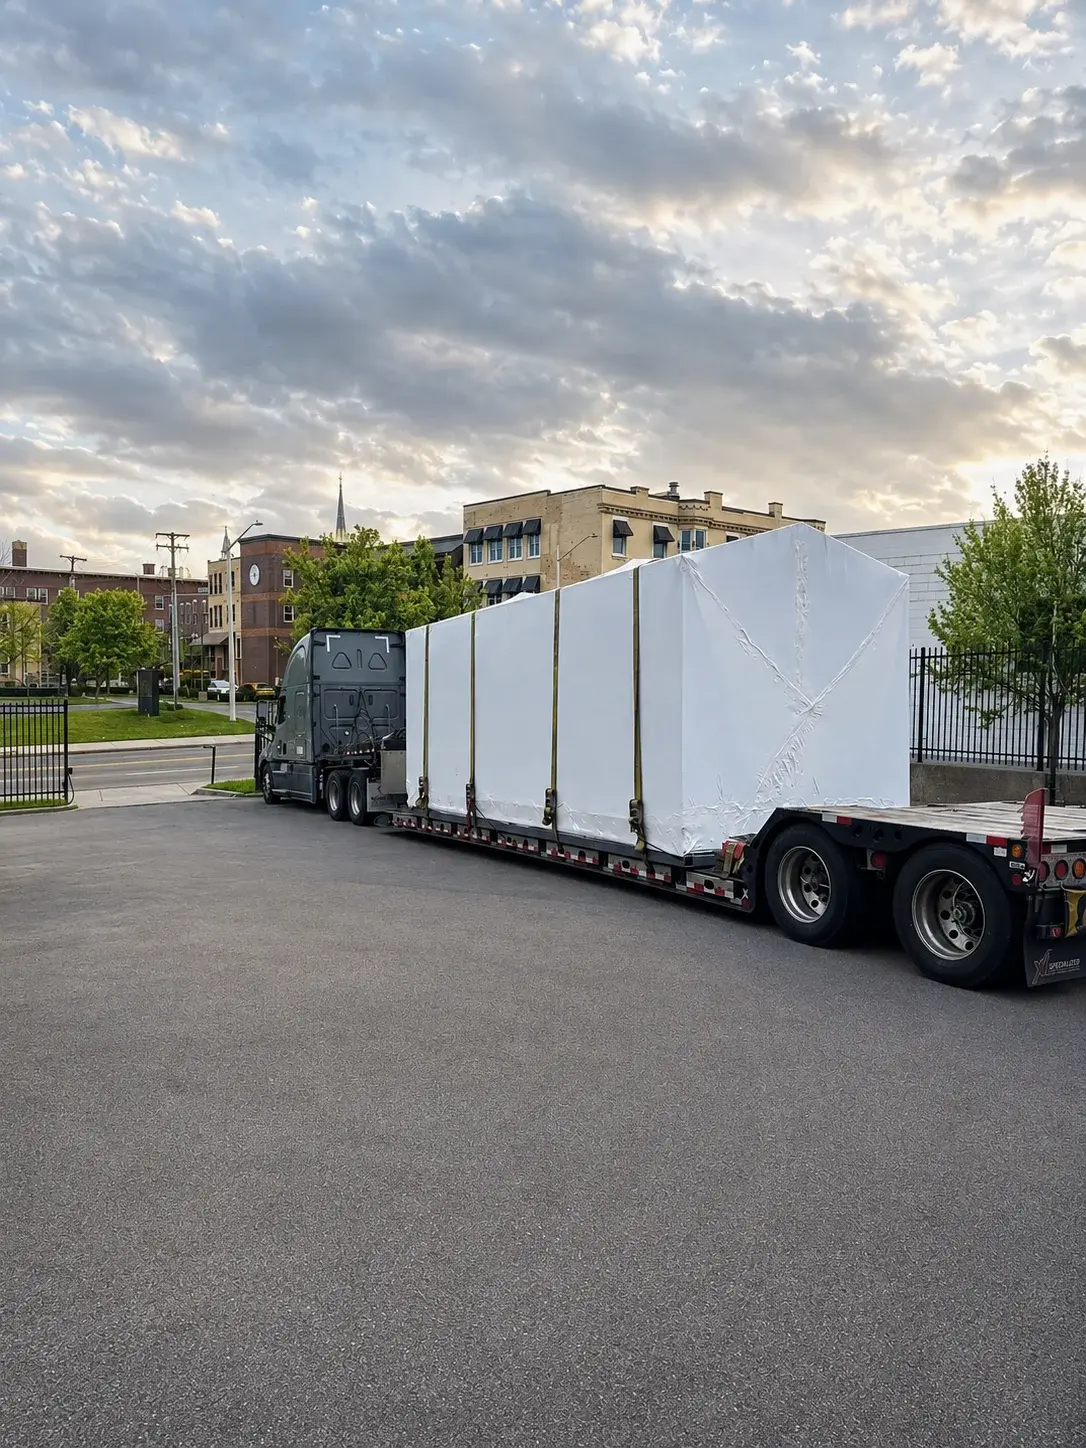
The reason this matters for a Pine-style property specifically is that titled, movable spaces give you options a foundation does not. A property that is truly seasonal can be planned around its own calendar, and inventory that is titled rather than fixed can, in a portfolio, be repositioned rather than left dark, though the honest transport math belongs in that decision too. Whatever path you choose, build the model month by month for year one, not as a single annual number, so the slow season is a line you planned for rather than a surprise you discover in the bank balance.
What this model deliberately leaves out
The operating surplus above is not profit, and treating it as profit is the most common way these models mislead. Four large items sit below that line, and a real business case has to carry all of them.
The capital cost of the spaces and the property. The surplus is a return on something, and that something is your all-in capital: the spaces, delivery, any platform and site work, and the land. Do not estimate this. Configure the exact spaces you intend to buy in Build & Price for an itemized number with transparent, distance-based delivery, and read what it costs to add cabins for how the space, the delivery, and the site work you avoid actually compare to a site-built path. That capital figure is the denominator of any payback or return calculation.
Financing and debt service. If you borrow, the loan payment comes straight out of the surplus, and its size depends on rate, term, and how much you put down. Fixed-asset financing for a small business is its own subject; the federal small-business lending programs are one place to start understanding long-term, fixed-rate options for major assets.[4] Model your actual expected payment, not a debt-free fantasy, unless you are paying cash.
Income tax, and how the asset is treated. The surplus is pre-tax, and how a property like this is taxed depends on facts specific to you and your structure. Pine's spaces are built and titled as movable equipment on a steel chassis rather than as real property, and that structural distinction has consequences worth understanding, which we cover in how a titled asset is treated differently from real property. We stop at the structural fact. Anything about depreciation, deductions, or tax outcomes is a question for your accountant, not for a Pine guide.
Your own time, or a manager's cut. If you self-manage, the surplus quietly includes payment for your labor, cleaning coordination, guest messaging, maintenance calls, and the software you run it on, even with Innkeeper handling the physical property from your booking calendar. If you hire a manager instead, a management fee, often a meaningful share of revenue, comes off the top. Decide which, and put a real number on it.
Rebuilding the model with your own numbers
The right way to use everything above is to throw away our bottom line and rebuild it. Standard guidance on writing a business plan is to produce forecasted income, cash flow, and capital statements, and for the first year to work in quarterly or even monthly detail.[5] That is precisely the discipline a seasonal property demands. Start from the operating lines in this guide, replace each illustrative figure with one you can defend, and build it month by month.
Once you have an operating surplus you believe, the simplest screen is payback: your all-in capital divided by your annual surplus, in years. It is a rough sniff test, not a real return, because it ignores financing cost, tax, the timing of cash within the year, and the time value of money. Run it with your own capital number from Build & Price, not with a figure borrowed from this page, and then hand a proper model to your accountant and lender. The goal of the exercise is not to reach a comforting number. It is to know exactly which assumptions your plan depends on, so you can go and test the two or three that matter before you spend anything.
That is the whole point of a pro forma done honestly. It does not tell you what you will earn. It tells you what has to be true for the plan to work, and it names those things clearly enough that you, and your advisors, can check them. Pine does not provide tax, legal, or investment advice; consult your own advisors, and build the model on numbers you can stand behind.
Frequently asked questions
- What does a four-space micro-resort earn?
- There is no single honest number, because the result is set entirely by inputs you control: your nightly rate, your occupancy, your platform fees, and your operating costs. Anyone who quotes you a return without showing those inputs is guessing. This guide gives a fully worked illustration, with every assumption printed, so you can rebuild it with your own numbers. Pine does not provide tax, legal, or investment advice; consult your own advisors.
- What occupancy should I assume for a short-term rental pro forma?
- Use your own market rather than a national average, because occupancy varies enormously by location and season. As an external benchmark, AirDNA reported U.S. short-term rental occupancy of about 55 percent for the first six months of 2025. A new, seasonal, rural property typically runs below that in its early years, which is why the illustration in this guide models a conservative 40 percent annual blend. Pull your own market and comparable properties before you commit to a number.
- What operating costs belong in a short-term rental model?
- At minimum: booking-platform fees, cleaning (net of any guest-paid cleaning fee), insurance, utilities and consumables, the Innkeeper service plan, and a maintenance reserve. A complete model also accounts for financing or debt service, income tax, the land, and the value of your own time if you self-manage. The illustration in this guide prices the operating lines and then names, separately, everything it leaves out.
- How do you calculate simple payback on a micro-resort?
- Simple payback divides your all-in capital by your annual operating surplus, and it is a rough screen, not a real return. It ignores financing cost, income tax, seasonality within the year, and the time value of money. Treat it as a first sniff test, then hand a real model to your accountant. This guide shows the arithmetic with an illustrative placeholder so you can drop in your own quote from Build & Price, not a Pine promise.
- Does Pine guarantee any revenue or return?
- No. Pine builds and delivers the spaces and the Innkeeper software; it does not operate rentals, does not set your rates, and does not promise revenue, occupancy, payback, or profit. Every figure in this guide is illustrative and labelled as such. Pine does not provide tax, legal, or investment advice; consult your own advisors before you build a business case.
- Where should the capital cost of the spaces come from?
- From a real, current configuration, not from a rule of thumb. Configure the exact spaces you plan to buy in Build & Price to get an itemized number with transparent, distance-based delivery, and read the cabin-cost guide for how the space, the delivery, and the site work compare to a site-built path. That capital figure is the denominator of any payback or return math, so it should be your number, not an estimate borrowed from a model.
Sources
- STR Data Lab, episode 143: midyear 2025 outlook (U.S. short-term rental occupancy for the first half of 2025). AirDNA.
- North American Camping & Outdoor Hospitality Report (camping participation and demand). Kampgrounds of America.
- Outdoor Recreation Satellite Account (value added, including RVing and camping). U.S. Bureau of Economic Analysis.
- 504 loans: long-term, fixed-rate financing for major fixed assets. U.S. Small Business Administration.
- Write your business plan: financial projections and pro forma statements. U.S. Small Business Administration.
This paper presents an illustrative financial model, not a forecast and not a Pine promise. Every figure labelled illustrative is a worked example built from the assumptions printed on this page; change the assumptions and the result changes. Third-party benchmark figures for occupancy, rate, and demand are attributed to their sources and are external references, not commitments by Pine. Pine does not operate rentals and does not provide tax, legal, or investment advice. Confirm every input, and the structure of any purchase, with your own accountant, attorney, and lender before you commit capital.
Working through this for a specific property?
Build & Price